Unit 2 Urbanisation
D. Writing
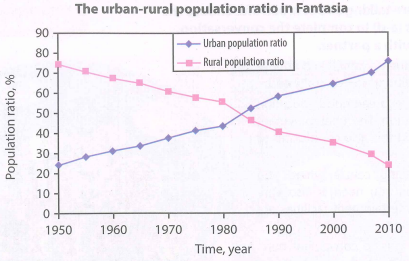
Bài 1. Look at the line graph and answer the following questions.
(Xem biểu đồ đường và trả lời các câu hỏi dưới đây)
1. What does the graph show?
2. What information is shown on the vertical axis?
3. What information is shown on the horizontal axis?
4. What patterns can you see?
5. What comparisons can you make?
Key
1. It shows the urban-rural population ratio in Fantasia from 1950 to 2010.
2. The population ratio in percentage.
3. The 60-year period from 1950 to 2010 (divided by ten-year intervals).
4. The urban population ratio increased, and the rural population ratio decreased.
5. The differences between the two patterns.
Bài 2. Rewrite the sentences without changing their meaning.
(Viết lại câu mà không làm thay đổi nghĩa)
1. The urban population ratio rose steadily throughout the period.
=> There_________________________________________
2. There was a continuous fall in the rural population ratio during this 60-year period.
=> The __________________________________________
3. The urban population ratio rose from 25% to 45% between 1950 and 1980.
=> There_________________________________________
4. From 1980 to 2010, there was a steady increase in the ratio of urban population.
=> From 1980 to 2010,_________________________________
5. The rural population ratio decreased by 50% from 1950 to 2010.
There_____________________________________________
Key
1. There was a steady rise in the urban population ratio throughout the period.
2. The rural population ratio fell continuously during this 60-year period.
3. There was a rise/increase of 20% in the urban population ratio between 1950 and 1980.
4. From 1980 to 2010, the ratio of urban population increased steadily.
5. There was a decrease/fall of 50% in the rural population ratio from 7 950 to 2010.
Bài 3. Write a description (of 130-150 words) of the trends in the graph.
(Viết đoạn mô tả (130-150 từ) về các xu hướng trên biểu đồ.)
Sample answer
The line graph illustrates the ratio between urban and rural population in Fantasia over a 60-year period from 1950 to 2010. Overall, the ratio of urban population went up continuously, while the rural population ratio experienced a steady fall.
In 1950,75% of the population lived in rural areas compared to only 25% of urban dwellers at the time. The next 30-year period saw some changes in the trend with more people (around 45%) living in urban areas and fewer people (less than 60%) living in rural areas.
Towards the end of the period, the trend was totally reversed. In 2010, around 75% of the population lived in urban areas, whereas just merely 25% still lived in rural areas.
In summary, as time went by, more and more people chose the city over rural areas to settle down.

Comments mới nhất